Trust, Design & Domestic Robots
Date - March 2019 to September 2020
Problem - Mapping the factors that affect trust in domestic automated vacuum cleaners.
Results - A trust relationship model based on literature and user studies.
Role - UX Researcher
Responsibilities:
- Research
- Prototyping
- Test Evaluation
Design Process
In this project we used the Double Diamond design process. The process is defined into four phases and works in an iterative manner where you are encouraged to go back to a previous phase at certain points of the project.
The Discover Phase is about understanding what the challenge is about. It is about gathering information through other research and by different methods to understanding the users. In the Define Phase the information from the Discover phase is processed and analysed. Iterate
During the Develop Phase ideas are developed and tested. This is the first phase where a product should be considered. Brainstorming methods, scenarios and prototyping takes place here. At the Deliver Phase the solution to the challenge is tested, and the productis improved Iterate
Discover

Literature Study
During this project we used a formal method for doing a literature study created by Joost Wolfswinkel and his colleagues. It's a five stage method where you divide the study into Define, Search, Select, Analyse and Present. This allowed us to make qualitative observations from the literature and see patterns in them that we could base our model on.
Interviews
We also conducted several interviews as a complement to our literature study. This was both done with users of robotic vacuum cleaners to create an understanding of what they saw as risks and factors affecting trust. Also an interview was conducted with a subject expert in the form of a product owner at a large company that builds robotic vacuum cleaners.
Define
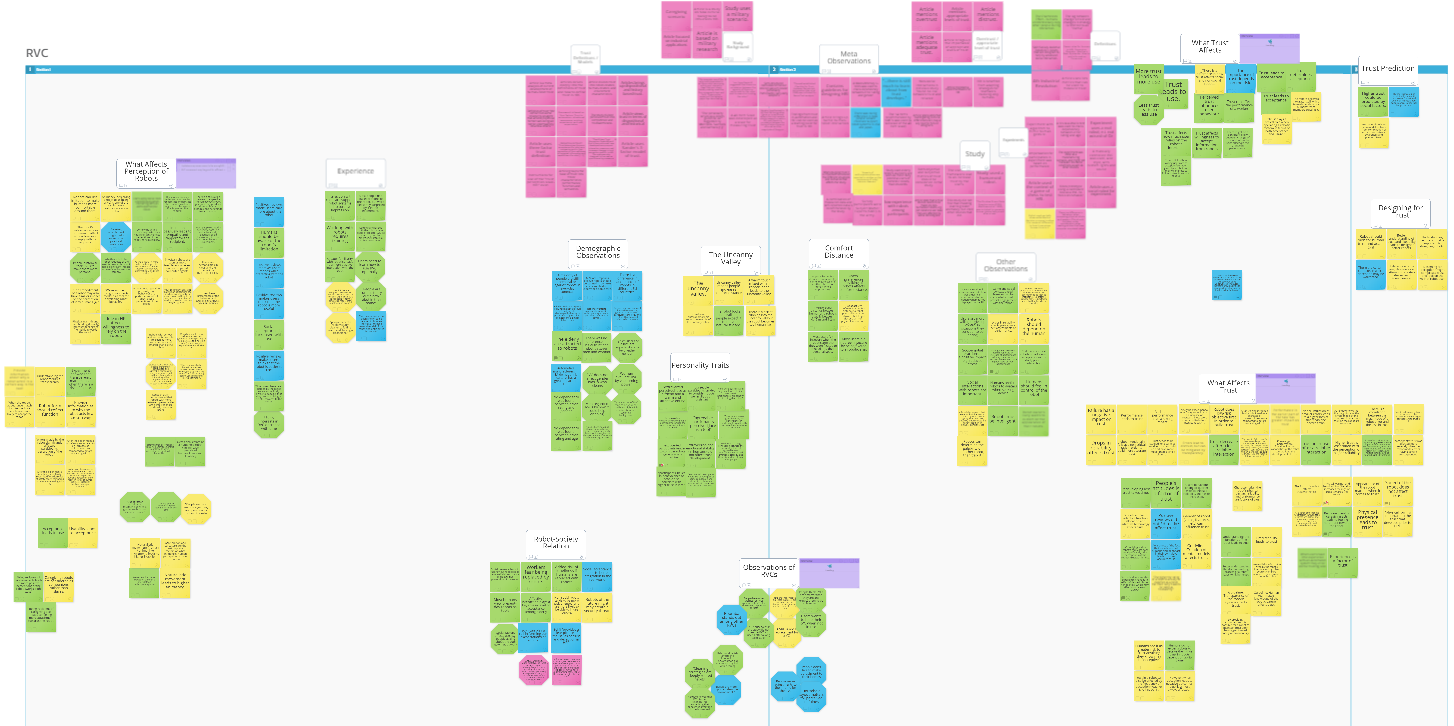
Affinity Diagram
When we went into the Define Phase of the project we used an affinity diagram to merge the findings of the literature study with the observations done during the interviews. For this we used a digital whiteboard and used colour coding and clustering to organise our observations.
For example a green note indicates that that observation is focused on the human perspective, while a yellow note is mainly about the robot. So a note that said "Trust leads to Use" would be green and be clustered together with a yellow note that "trust affects different type of robots differently"

Forming the model
At that point we started to create our model. The different factors that had been identified through the Affinity Diagram were drawn on our model. If two factors had a relationship between them an arrow was drawn between them.
For example the observation that "Trust leads to Use" was represented by writing down both Trust and Use in our model and drawing an arrow from trust to use.
Develop
Prototyping
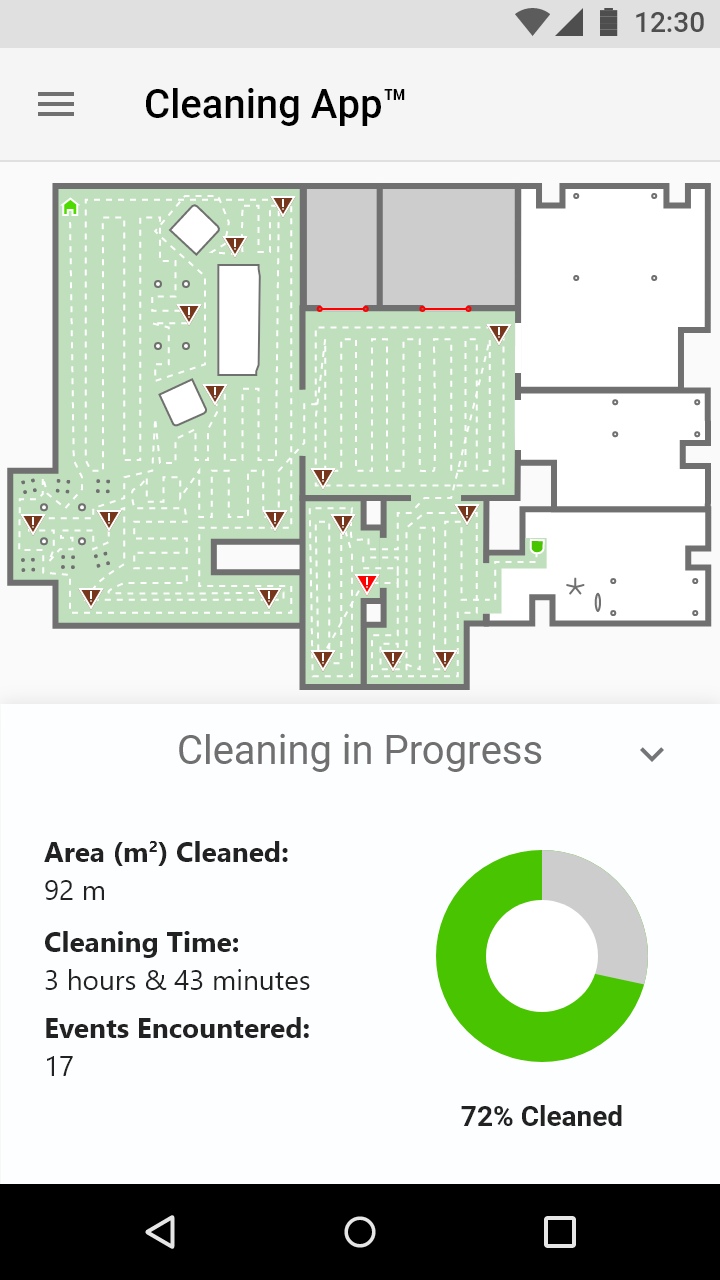
We decided that we wanted to test the relationship between transparency and trust in our model and created an app prototype in order to see if transparency always leads to more trust or if there could be a point where too much information leads to less trust.
This part of the project was interesting as it was the only time I have intentionally tried to create a bad UX. And as such I had to intentionally flip a lot of lessons I have learned about what makes a good UX. We also created a more clean version of the UI that would serve as a comparison.
User Testing
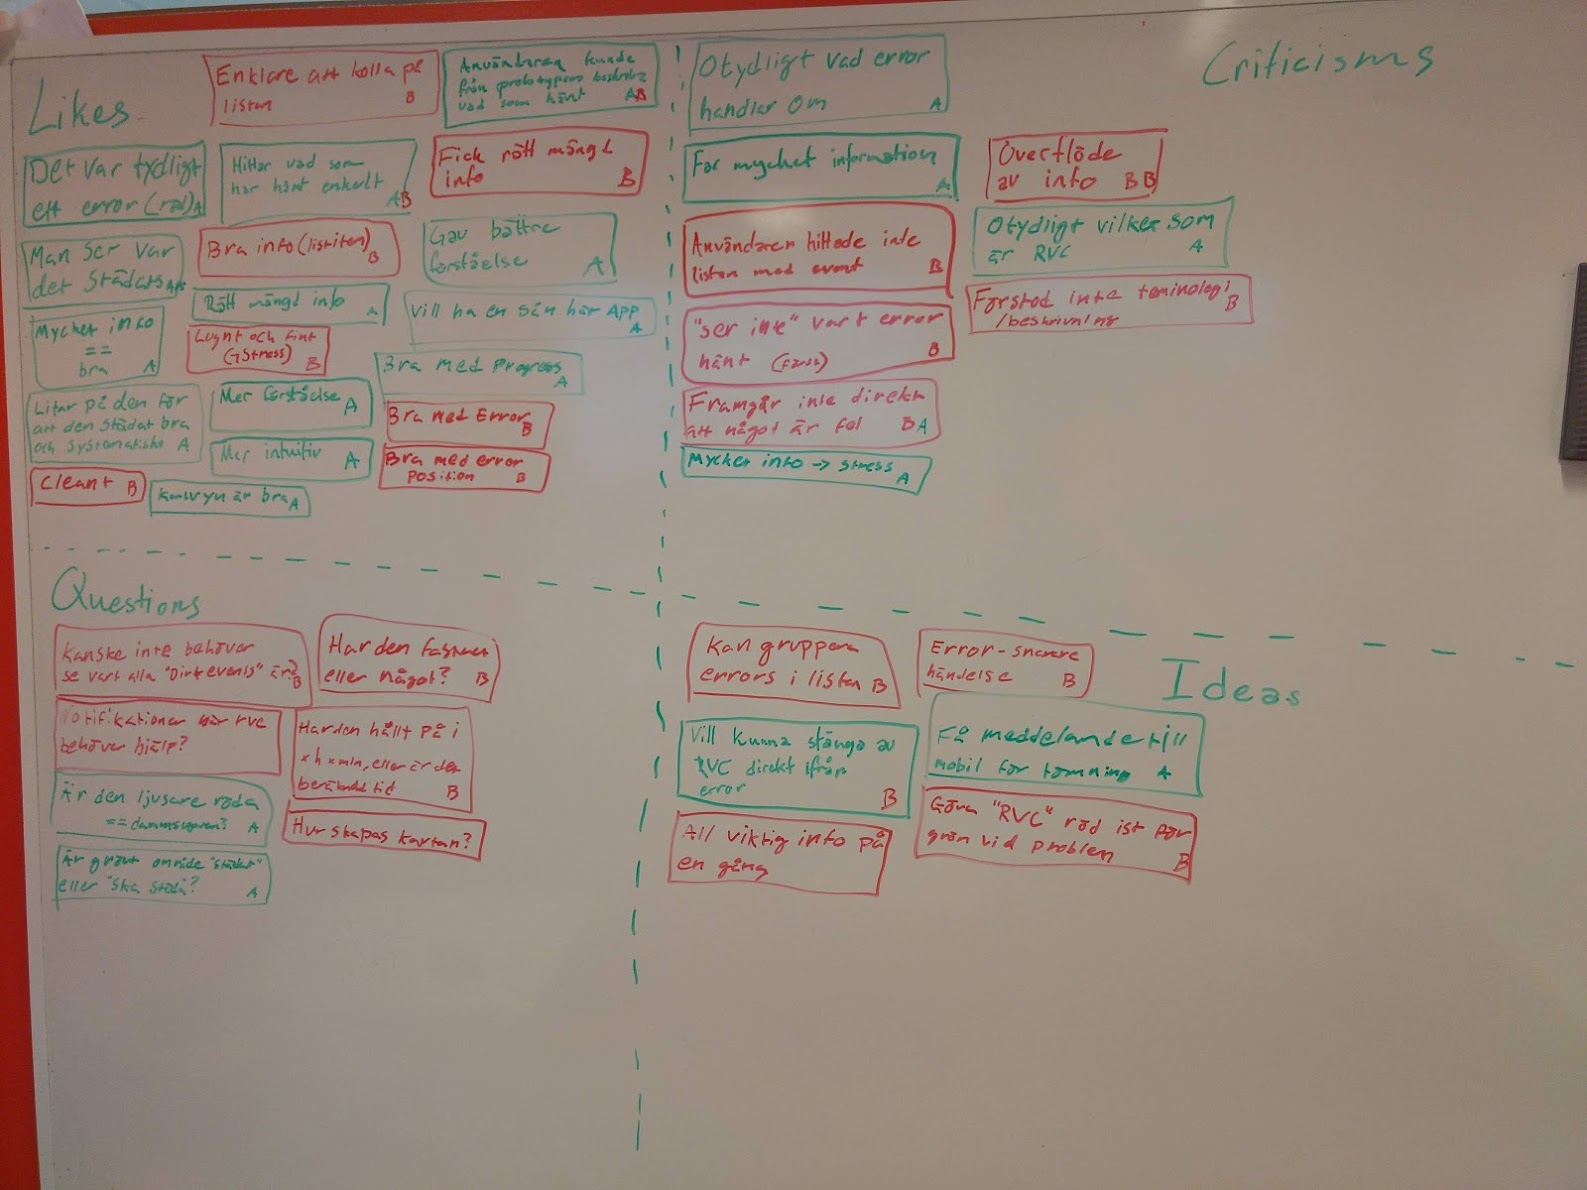
We tested our prototypes by bringing in owners of robotic vacuum cleaners and setting up a scenario where they were at work and were sent an error message through the vacuum's app. Their responses to the app were measured using Likert Scale as well as more freeform questions. We also asked general background questions regarding their vacuums.
The qualitative data gathered during the test was then analysed using a Feedback Capture Grid. This allowed us to get an overview of what was similar and different in the responses that our testers had given us.
To our surprise our cluttered interface scored slightly higher on trust than our clean version, thus indicating that transparency always leads to higher trust. More predictably, however, it did score worse in user experience.
Deliver
This project was requested by a group that researches trust in autonomous vehicles to serve as a complementary to their research. In this we were successful and our project owners were happy with our results. We presented our model graphically (seen here on the right) as well as a report on how we got our results and how we interpreted said results.
On a more personal level it was a great experience for me. For the first time I had a project that was large enough that I felt that I really got to experience what it is like to work with a design process. I also had lots of freedom to organize the project and got to experience what needs to be considered when deciding which methods to use, which I felt was an incredibly valuable experience.
However, as this was an academic project there are certain things I would have changed if I would have done it in a business setting. For starters I would have put more effort into the aesthetics when it comes to how we presented our findings, as well as the economical aspects of our work. For example we discussed among ourselves if having too much trust in a robot really is a problem for vacuums, unlike autonomous cars where too much trust might cause accidents. Had this been a commercial project I would also have liked to investigate how trust affects sales in a way we didn't do during this project.
Overall this project was a valuable experience and I am happy with the results.
Go Back